 OrbFlow Labs
ORB Levels & Orderflow
A chart tool for opening range traders. It maps the ranges you trade, marks what price does around them on bar close, and shows the footprint delta and daily levels next to every event. It gives no buy or sell signals: it shows the map and the context, and the decision stays with you.
Up to three session opens
- New York 09:30–09:45 and London 08:00 on by default, Tokyo 09:00–09:15 optional.
- Each session has its own range time, timezone and live window: how long after the range its levels stay active.
- High, low, midline and light shading for every range.
- A trigger line a set distance outside each edge (4 points by default) filters wicks and one-tick pokes through the range.
- Session times follow the timezone you pick, so daylight-saving changes are handled for you.
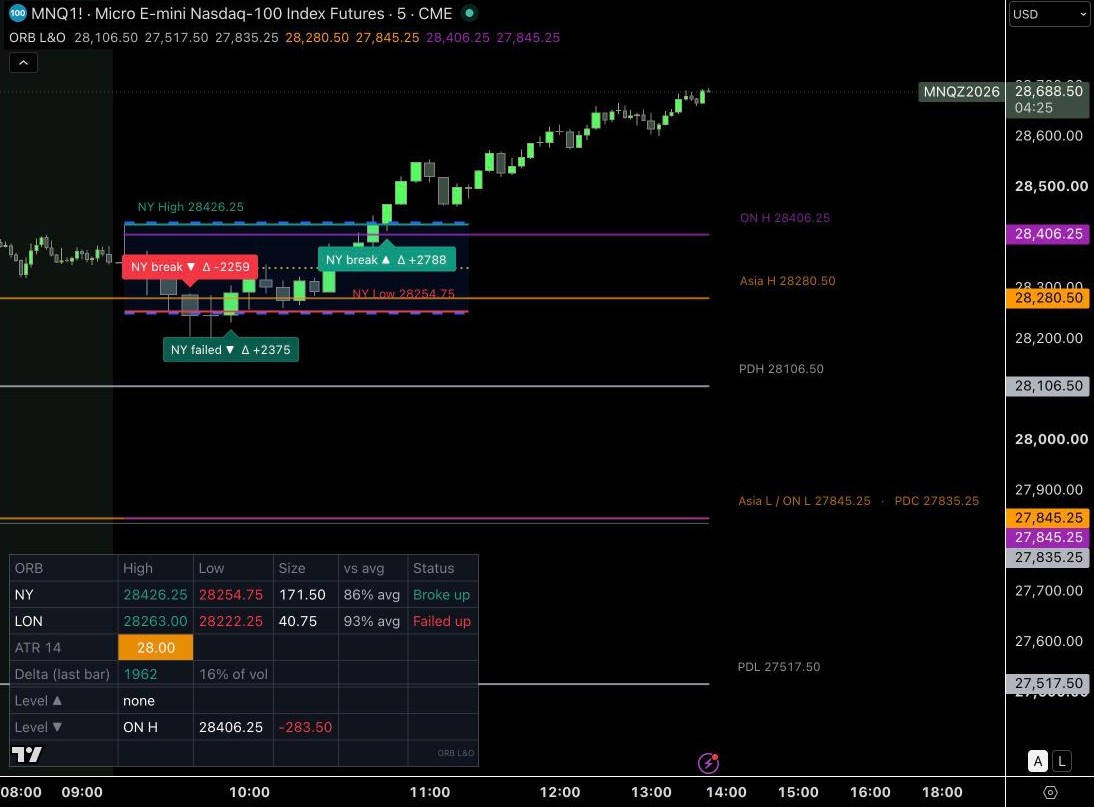
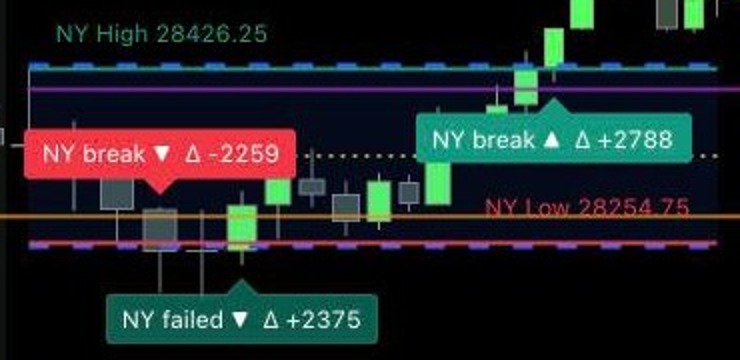
What price did at the level, and who pushed it
- Break: the first bar that closes past a trigger line.
- Failed: a break that closes back inside the range within a set number of bars (10 by default).
- Retest (optional): after a break, a bar touches the trigger line and closes beyond it again.
- Every label shows that bar's footprint delta, e.g. NY break ▲ Δ +2788: aggressive buying or selling behind the move, at a glance.
- All events are confirmed on bar close and never repainted.
The levels a break runs into
Previous day
High, low and close of the prior completed day. No future data, ever.
Asia session
High and low from 18:00 to 03:00 New York time.
Overnight
High and low from 18:00 to 09:30 New York time.
Every level is labelled above its line. Levels that sit close together share one label (Asia L / ON L 27845.25 · PDC 27835.25), so text never stacks on top of itself.
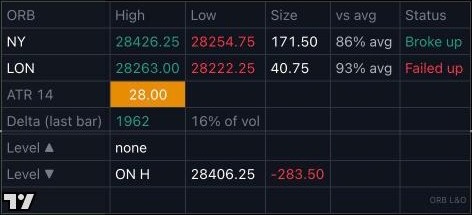
Session context in one table
- Each range's high, low and size, and its size as a % of the last 20 sessions.
- Status: Forming, Live, Broke up/down, Failed up/down, Retest held, Closed.
- ATR (14) coloured on green, orange and red bands you set.
- The last closed bar's delta and its share of that bar's volume.
- The nearest level above and below price, with the distance in points.
- Six positions and three text sizes, so it fits around your other tools.
Five alert conditions
Range set, break up, break down, failed break up and failed break down. Or set one alert on "Any alert() function call" to get every event with its price and delta in the message. All alerts fire once per bar close.
Built for index futures, adjustable for more
Point-based defaults are tuned for Nasdaq futures (NQ/MNQ). Rescale the trigger distance and ATR bands for ES, gold, oil, indices or CFDs. Best on 1- to 5-minute charts.
Limitations
- Footprint delta needs a TradingView Premium plan or higher. Without it the delta shows "n/a" and everything else works normally. Delta history depth also depends on your plan.
- Events are bar-close only. That's what keeps history honest, but you're always told one bar after the move.
- A range can't be finer than your chart's bars. The default London range is the 08:00 one-minute candle; on a 5-minute chart it becomes the whole 08:00–08:05 bar.
- Asia and overnight levels assume near-24-hour trading. On instruments that don't trade overnight they'll be empty.
- Intraday only. On daily or higher timeframes the ranges can't form. Use standard candle or bar charts.
- It's a charting tool, not a strategy. It doesn't tell you when to trade, and nothing it shows predicts future prices.